What’s the real story behind the shopping carts during BFCM? That’s what we were determined to find out. *Cue the SVU dun dun*
As the much-anticipated Black Friday Cyber Monday madness inches closer, you’re probably knee-deep in planning mode. Before you finalize those plans, we’ve got the latest data to help you inform your BFCM strategy!
We recently surveyed 1,117 consumers to get the hottest shopping trends for BFCM 2023 and put them together for you in the annual BFCM Consumer Shopping Trends 2023 report.
Not ready to dig into this in-depth report? We get it—we’re skimmers too. Here are 8 key findings we got from the data. Let’s dive right in.
Finding #1: The forecast for BFCM is uncertain
Are you unsure how BFCM is going to play out this year?
So are your shoppers.
This year, 67% of survey respondents said they are highly likely to shop BFCM. While that’s still 2 out of 3 shoppers, it’s actually down from last year’s 72%. That’s five percentage points—a statistically significant number.
More shoppers are less sure about their BFCM plans. Consumers that said they’re somewhat likely to shop during BFCM jumped to 32%, up 6 points from 26% in 2022.
One number that hasn’t changed is from those die-hard anti-BFCM shoppers. Those who are not at all likely to make BFCM purchases have held steady year-over-year at just 1%.

So where’s the change coming from? Millennials and Baby Boomers are driving the shift. Millennials that are highly likely to shop BFCM dropped from 76% in 2022 to 69% this year—a 7-point drop. The Baby Boomer generation reported the most significant change in certainty, with a 12-point decrease. This year, only 56% say they’re highly likely to participate in BFCM, while last year, 76% said the same.
Consumers aren’t sure what BFCM will look like this year—and expert opinions are definitely mixed. From what we’ve seen, people are still mildly optimistic despite this year’s challenges. The Shopify Commerce Trends 2023 also agrees that 'the only constant in commerce is change'. Our advice? Plan for a turning point (for the better) but also be prepared for the unexpected.
Finding #2: Excitement is up ⬆️ and stress is down ⬇️
While consumers seem hesitant to make big moves this holiday season, it’s not for lack of enthusiasm. There’s a lot of excitement (and not nearly as much stress as usual) for BFCM this year.
Our surveyed consumers are hyped about BFCM—with 97% reporting excitement. That’s 2 points higher than last year’s still very respectable 95%.

And their stress levels? Only 36% say they’re stressed to a medium or large extent about BFCM shopping this year, compared to 41% last year. 30% of consumers say they don’t feel any BFCM stress at all, an increase from 28% in 2022.
Is this because online and mobile shopping has made it easier to snag those sales? We can’t say that for sure, but we think that’s an important factor. According to research from Criteo, shoppers have pivotedaway from physical experiences and toward online shopping which is up by 13% YoY.
Finding #3: Shoppers actually like your BFCM ads
Think your ads are overwhelming your audience? That might not be the case for most consumers. They actually like (and are even excited by) ads about BFCM sales.
A whopping 93% of consumers say they feel at least somewhat excited by BFCM ads, and only 7% say they feel very annoyed by them.

One in 10 consumers reported being turned off by the BFCM messaging they receive, but 70% find the messaging in BFCM ads appealing. And 1 in 4 rate them as extremely appealing.
It seems like BFCM ads are striking the right chords with many consumers. Continue this success by segmenting your audiences and targeting them with the right BFCM message at the right time.
Finding #4: Budgets are a split decision this year
BFCM shoppers are humming should I stay or should I splurge now this year (to the tune of The Clash, duh) as they craft their budgets for the biggest spending weekend of the year.
As it turns out, 82% of consumers have a BFCM budget at least sometimes—and of that 82%, most (71%) say their budget is between $100 and $500. And 15% say their planning to spend upwards of $700.
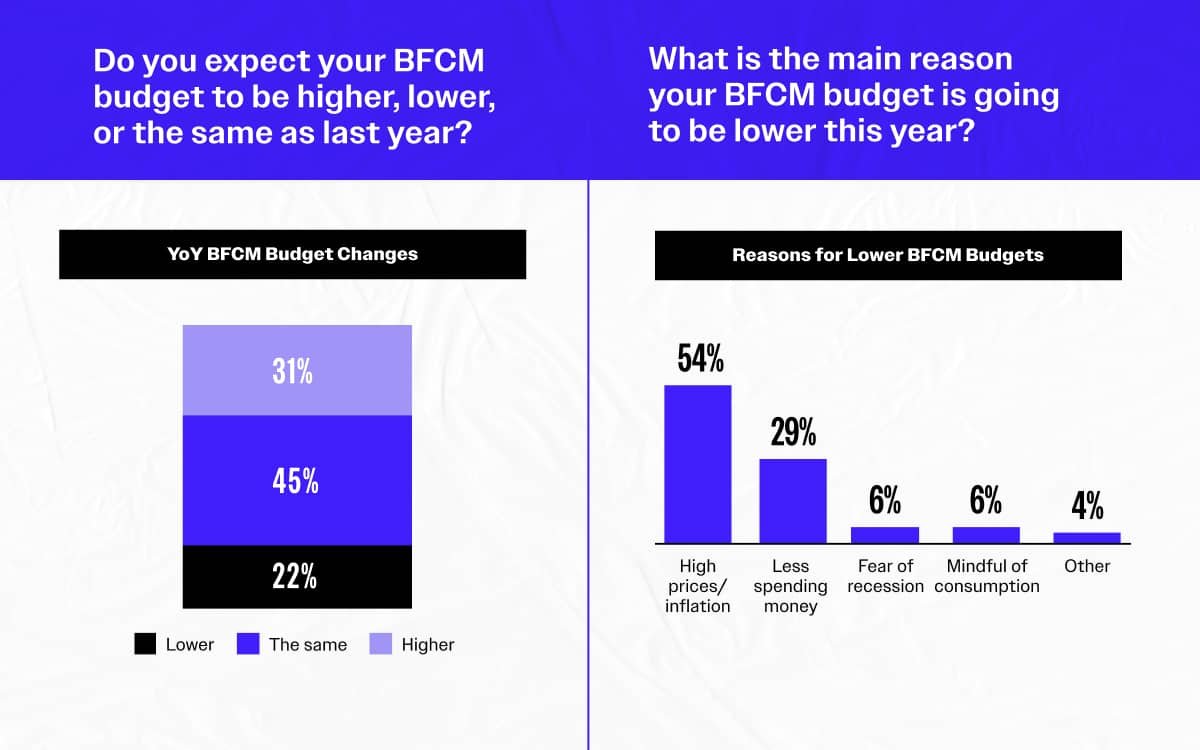
This year, 31% of shoppers plan to increase their budgets, while 45% will have the same budget. That’s a 5-point increase from 40%, whose budgets remained the same last year. This makes sense since more people are uncertain about their BFCM shopping plan for the year.
The remaining 22% plan to have a lower budget this year. Why? Those who plan to have a lower budget cite high prices, inflation, and less spending money as the primary reasons.
Finding #5: Social media is not the BFCM MVP
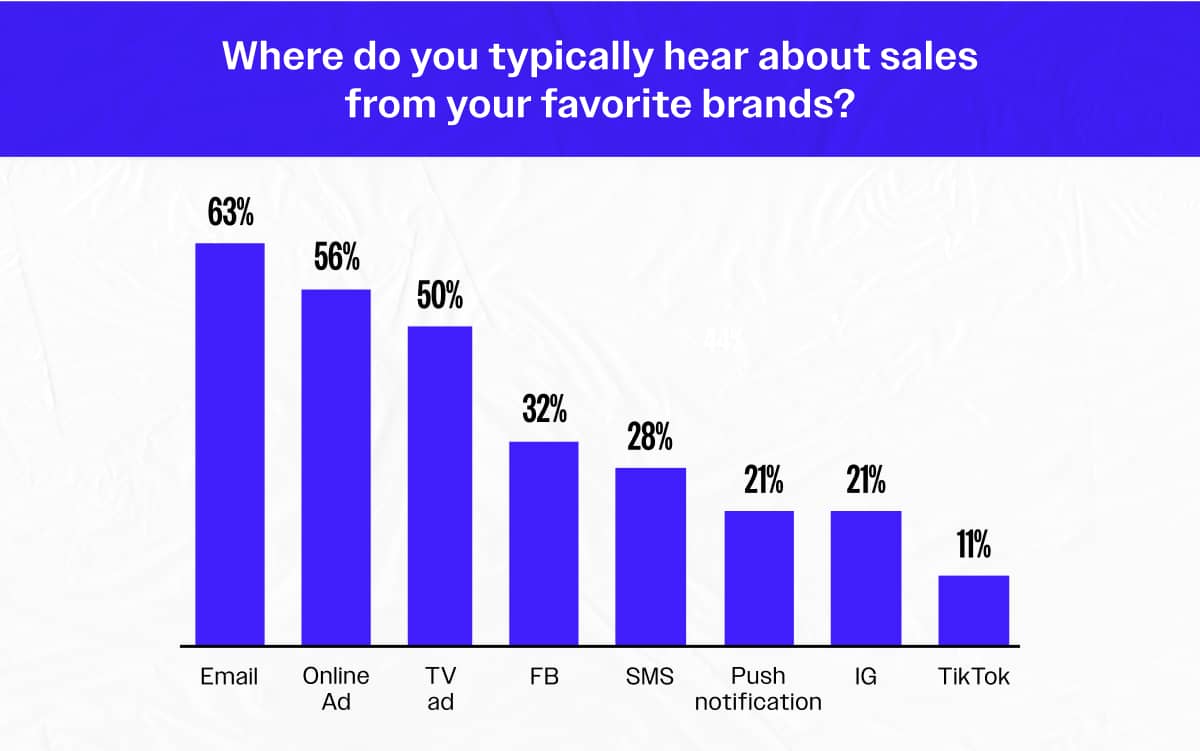
Social media is losing its BFCM sparkle. There’s been a significant drop in the number of reported shoppers who hear about sales from brands on Facebook, Instagram, and TikTok from last year.
Let’s look at the deets:
- Facebook dropped 8 points—from 40% to 32%
- Instagram dropped 10 points—from 31% to 21%
- TikTok dropped 5 points—from 16% to 11%
Instagram’s drop is notable—especially since it’s supposed to be the place for online shopping. People just aren’t hearing about the big sales through social like they used to (pretend to be shocked, here).
Conversions (eliciting a purchase) didn’t fair much better. Paid social’s effectiveness dropped by 8 points, with only 36% of consumers reporting they purchased directly from an ad.
You’re not imagining it’s been more difficult to reach audiences this year—the customers are feeling it too. This year might be the time to rethink heavy social strategies and look to a holistic retention strategy.
Finding #6: How much BFCM buzz can each generation handle?
So let’s talk unsubscribes. On average, 17% of consumers are more likely to unsubscribe during BFCM than throughout the rest of the year. And it varies across generations.
Gen Z respondents had noticeably less patience with sales emails, with 24% saying they were more likely to unsubscribe during peak season. Yet, Boomers don’t seem to mind the sales offers—only 11% were more likely to unsubscribe during BFCM.

Gen Z is also more sensitive to message frequency, with 75% of Gen Z saying “getting too many messages” during BFCM would make them unsubscribe, while only 62% of Millennials, 60% of Gen X, and 57% of Boomers said the same. It's important to prepare effective strategies to prevent subscriber churn during BFCM and, ultimately, boost your brand's long-term growth.
Those meddling kids have no problem cutting wack emails out of their lives. *Shakes aging fist in the air.*
Across the board, 37% of consumers prefer shopping on a mobile app to a mobile website. Younger generations are leading the pack—43% of Gen Z shoppers prefer downloading mobile shopping apps rather than shopping on a mobile-responsive website. Gen Zers are simply too large of a group to ignore. Younger generations are flexing their (increasing) buying power, and brands without mobile apps risk falling behind.
Finding #7: Treating yourself or sticking with gifts? It depends on your generation
When people fill their shopping carts on BFCM, is it with gifts for loved ones or treats for themselves? Our survey showed 69% of consumers' purchases are gifts for others, and 31% are for themselves.
And age makes a difference here, too.
Younger generations shop more for themselves, and older generations shop for gifts. Gen Z are significantly more likely to buy items for themselves–reporting that 38% of their holiday season purchases are for themselves.
Baby Boomers, meanwhile, report 75% of their holiday season purchases are for others, and only 25% are for themselves.

Finding #8: Push notifications are sealing the deal
Push notifications are the dark horse you didn’t see coming. Our survey found that 38% of respondents have purchased directly from a push notification, while only 36% have purchased from social media and 26% from a text message.

Push notifications might not be the typical route people learn about sales; it’s the most effective at driving BFCM purchases. Why? It’s likely due to a less crowded mobile app space and how well they roll out the red carpet—making it easy to go from “add to cart” to “buy” in just a few taps.
Want the full story? Read the report in all its glory here
These may be the MVP findings, but there are many more insights to mine in our 2023 BFCM Consumer Shopping Trends Report. and let us know how you use the data to craft your BFCM strategy!
About the author

Content strategist and creative producer. I'm passionate about learning the latest ecommerce trends and helping brands scale their businesses.
.png)